Data analysis is a bit like mining for gold. In gold mining, sluice machines sift through tons of dirt before finding a few ounces of gold. The dirt to gold ratio is high. Finding insights in data is similar to gold mining, in that you have to sift through a lot of data to find some small nuggets of insight.
In gold mining, prospect holes are dug to see if there is any unusually large deposits. Based on the results of the prospect holes, they may pick the best one and drill deeper.
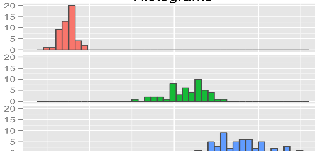
With analytics, we also do something like prospect holes. We use a technique is called EDA (exploratory data analysis) in which we make different plots of the data to see if there are any interesting relationships or patterns that are worth “digging” into further. It is often the result of EDA that allows you to form your initial hypothesis. Some popular plotting techniques include
Correlation Matrix
Marginal Plots
Box Plots
Residual Plots.
