Bayesian statistics is an alternative to another form of statistics called frequentist statistics. Bayesian statistics can be a useful tool for situations in which frequentist methods fall short.
The main idea: Bayesian analysis lets us reason backwards from one conditional probability to its reverse conditional probability.
This may sound a bit weird but let me explain the idea. This post will be a bit longer than others. Before we begin, let us review the concept of conditional probability.
Conditional Probability
Imagine that there are two jars each containing a mix of 100 red and white candies. Jar 1 has 60 white candies and 40 red candies. Jar 2 has 40 white candies and 60 red candies. Let us consider two probability questions. One candy will be picked from a jar.
Question 1. What is the probability that a white candy will be picked from a jar?
There are 200 candies in total between the two jars. There are 100 white candies in total: 60 white candies in Jar 1 and 40 white candies in Jar 2. The probability of picking a white candy is therefore 50% (100/200).
Question 2. What is the probability of picking a white candy given that it was picked from Jar 1?
Question 2 is a conditional probability question. We are asked to determine the probability given another event has occurred. The word given helps us with the intuition that some condition is in place. It is written P(A | B). The pipe between A and B represents the word given and is read “the probability of A given B”. For this question we would write P(White Candy | Jar 1). The given condition tells us the probability space is reduced to just Jar 1. We know there are 100 candies in Jar 1, 60 of which are white. So the probability is 60% (60/100).
Reverse probability of question 2
What if we wanted to determine, what is the probability of a candy coming from Jar 1 given that it is white: P (Jar 1 | White Candy)? This is a reverse conditional probability. Answering this question is not as straightforward, but Bayes Theorem will give us the answer.
Conditional Probability and Reverse Conditional Probability in Practice
Candies are nice but not a real world situation. Let’s look at a question that could happen to one of us. Let’s say that you are not feeling well. You have a cough and a headache. You go to an internet medical site and find several illnesses that include a cough and headache as symptoms. After reading several articles, you are pretty sure you must have a disease called statiscitis. The article says that:
- 1% of people in the general population get statiscitis
- The test for statiscitis is 80% accurate. In other words, 8 out of 10 tests correctly identify statiscitis.
- 10% of tests incorrectly detect statiscitis when it is not present. In other words, 1 out of 10 tests incorrectly indicates the presence of statiscitis, when the patient does not have the disease.
You go to the doctor and a test is recommended. You are given the test and it comes back positive. You are worried because you remember reading that the test is 80% accurate.
Question: What is the probability you have the disease statiscitis given you get a positive test?
We can see that this is a conditional probability question because of the word given. Many people think the answer is 80%. But when we read this carefully we will see that this is a different question. 80% is also a conditional probability: it is the probability of getting a positive test given you have the disease. But we want to know the reverse probability: the probability of having the disease given you get a positive test.
We have some numbers from the article that we can us so let us assign those to some variable names. Let
- Dpos be that you have the disease
- Dneg be that you do not have the disease
- Tpos be you get a positive test
- Tneg beyou get a negative test
We know some probabilities:
= 0.01 =1%
= 0.8 = 80%
= 0.1 = 10%
We want to know this equation’s reverse probability which is:
")
From the data above, we don’t have the answer to this question. But we can figure it out using Bayes Theorem.
Starting from:
 = \frac{P(D_{pos} \mid T_{pos}) * P(T_{pos})}{P(D_{pos})}")
through some calculations that I won’t show here, Bayes Theorem gives us this reverse conditional probability equation:
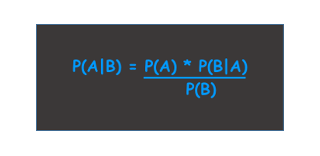
 = \frac{P(T_{pos} \mid D_{pos}) * P(D_{pos})}{P(T_{pos}) }")
Below are two explanations
- An intiutive solution using simple tables and ratios
- The solution using Bayes Theorem
Intuitive solution with ratios
Let us piece this together intuitively step by step.
Step 1 – Place the data we know into a 2×2 grid showing the truth in columns (does one have Statiscitis or not) and the test result (is it positive or negative) in rows. Place the three probabilities we know into the grid.
| Statiscitis Dpos | No Statiscitis Dneg | Total | |
| Positive Test Tpos | 80% | 10% | |
| Negative Test Tneg | |||
| Total | 1% |
Step 2: Fill in the blanks so that the column totals sum to 100%
numbers added to table
Note that the 1% is a row total. It states that 1% of the total population has statiscitis.
| Statiscitis Dpos | No Statiscitis Dneg | Total | |
| Positive Test Tpos | 80% | 10% | |
| Negative Test Tneg | 20% | 90% | |
| Total | 1% | 99% | 100% |
Step 3: Assume a population size of 1000, and convert the percentages to number of people.
numbers added to table
| Statiscitis Dpos | No Statiscitis Dneg | Total | |
| Positive Test Tpos | 80% | 10% | |
| Negative Test Tneg | 20% | 90% | |
| Total | 1% | 99% | 100% |
Step 4: Sum the row total number of people
numbers added to table
| Statiscitis Dpos | No Statiscitis Dneg | Total | |
| Positive Test Tpos | 80% 8 people | 10% 99 people | 107 people |
| Neg. Test Tneg |
20% |
90% |
893 people |
| Total |
1% | 99% |
100% |
Step 5: Convert the total column to percentage of total population.
numbers added to table
| Statiscitis Dpos | No Statiscitis Dneg | Total | |
| Positive Test Tpos |
80% |
10% |
10.7% |
| Neg. Test Tneg |
20% |
90% |
89.3% |
| Total | 1% | 99% | 100% |
Now we have what we need to answer the original question: What is the probability that you have the illness given a positive test.
Step 6: Calculate row percentages
numbers added to table
| Statiscitis Dpos | No Statiscitis Dneg | Total | |
| Positive Test Tpos | 80% | 10% | 10.7% |
| Neg. Test Tneg | 20% | 90% | 89.3% |
| Total | 1% | 99% | 100% |
We can now look to this table to see where this probability is stated. It is the intersection of the row Tpos and Dpos which is 8 people.
We divide 8 people out of the 107 people who got a positive test (this is the given condition).
Therefore, the probability of having the disease given a positive test is just 7.5%.
Solution using Bayes Theorem
Above we stated this is the equation we use to answer our question:
 = \frac{P(T_{pos} \mid D_{pos}) * P(D_{pos})}{P(T_{pos})}")
We have all the parts we need
")
We plug these numbers into
Answer:
This is the same number we got above 8/107 = 7.5%